
UPDATED

Actis Atlas – Is it working?

In short, it is. The granular characterisation of country buckets we introduced in a Street View Special (June 2023) has aligned to differential FX outcomes since then. We argue this will continue.
These buckets are Global Influencers, Big Middles, Supply Chain Heroes, Stable but Small, Natural Resource Winners, and Structurally Challenged (see Exhibit 1).
Share

In the interests of simplicity we confined countries to a single bucket. The unifying theme is investment risk – using currency performance and volatility for floating regimes and fiscal credibility for fixed rates.

This is not a framework for rejection or selection, but a series of working titles to assist effective investment and portfolio management. It does not determine what are the best places to invest – the variables employed are easily observable and therefore discountable.

Segmenting risk allows for potential mitigation strategies. Understanding what you are addressing, and why, is above all the stock-in-trade of portfolio management excellence. What looks too risky can become rewarding with good financial and operational risk management, as well as purchase price levels.

Have our categories delivered different currency outcomes of late?

They have (see Exhibit 2 and Exhibit 3).

Big Middles (MXN, BRL, INR, KRW) was clearly the best performing group last year (up +5%). The currencies of Stable but Small (RON, BGN, UYU, MAD) also performed decently in 2023 (as a group, up +3%). Global Influencers (DXY, CNY, JPY, EUR) and Natural Resource Winners (CLP, ZAR, PEN, IDR, COP) saw more mixed results, reflecting divergences in domestic factors and commodity prices, respectively. The currencies of Supply Chain Heroes (VND, MYR, THB, PHP, BDT) were more cyclically challenged last year by declining global trade momentum (as a group, down -2%) but as demonstrated by their low volatility in 2023, they remain embedded in sound fundamentals and there’s no regime change risk. Finally, the currencies of Structurally Challenged (TRY, EGP, GHS, KES, NGN) performed the worst last year (down -28% using official exchange rates and over 50% in parallel markets).

Just as important as short-term outcomes are the longer term balance of risk. Leopards do change spots in FX markets and there are plenty of examples of rapid snap backs. That said, we note that having sound fiscal and monetary policies and some reasonable domestic savings base are essential to prevent the workings of Gresham’s Law (good money is hoarded, bad money spent rapidly). As long-term investors in illiquid assets this belief is critical. There will be months or years where these fundamentals do not work but rarely, or ever, decades.

Exhibit Links

Click to open full screen exhibits

Exhibit 2

Exchange rate performance, year-to-date and historical.

Exhibit 3

Exchange rate volatility (annualised), year-to-date and historical.

Exhibit 1

Actis Atlas – A Country Taxonomy

  • All
  • Global Influencers
  • Big Middles
  • Supply Chain Heroes
  • Stable but Small
  • Natural Resource Winners
  • Structurally Challenged

Global Influencers are givers rather than takers of global investment risk. Domestic factors – starting with monetary policy decision (e.g. interest rate decisions, liquidity management, yield curve control) – account for most of the currency variation in this subset (see Exhibit 4).

Exhibit 4 What drives currencies?
These dynamics continued to play out last year. These economies continue to drive global outcomes in growth, inflation and interest rate space. Within this group currency performance heterogeneity was also the largest across Atlas buckets (together with Natural Resource Winners). This goes back to divergences in domestic monetary policy decisions (e.g. Japan vs US) and economic conditions (e.g. China vs US) that tend to drive these currencies.
The persistency of strong dollar through most of 2023 reflects slowing global growth against a backdrop of relative US economic resilience as well as higher US yields. The most pessimistic forecasts for 2023 in the United States failed to be met. Whereas most commentators had expected a recession last year full employment and pandemic savings drawdowns have supported consumption. At this stage there is only a moderate probability of a full-scale recession in 2024. If this turns out to be too optimistic and/or US rates decline steeply then some dollar weakness against Asian currencies may emerge.
China has struggled under the weight of property losses and diminished household confidence. Chinese government policy is focussed on combatting the impact of a property led balance sheet recession. Such policy influences have worked in the past – 2024 is set up for an acid test of the efficacy of official policy. The Chinese renminbi is also under some pressure both from Japan and South Korea weaponizing their currencies to compete and may weaken further against the dollar as a result.
Europe gradually slipped towards recession as last year progressed. ECB tightening has helped euro though as a counterforce. Any pronounced dispersion between bond yields brought on by deteriorating fiscal dynamics and private sector balance sheets puts the euro at risk against the dollar. The EU aims to reintroduce the Maastricht Criteria on debt and deficit levels in 2024 with the almost certain outcome that few member states can meet targets of 3% deficits and 60% debt to GDP for the very long-term foreseeable future. 2024 will be a year when the ECB has to kick the can very hard to keep it on the road, potentially risking inflation fighting credibility.
In Japan the yen has been primarily driven by the large yield differential with the US and its outlier YCC policy. It has also mimicked the RMB and won tracking lower against the USD. For this to change either China succeeds in reflation, capital flows into China reverse their declines of the last 2 years, YCC is abandoned and/or US rates decline steeply. Many of these conditions are self-contradictory.
Big Middles are G20 members with substantial financial resources and resilience. Their resilience derives from savings not credit flows. These are natural investment destinations – given low or declining currency volatility, high real rates and Central Bank credibility – provided inappropriate policy does not dilute opportunity. Their currencies have limited exposure to a single factor and are rather driven by a mix of drivers (trade balances, energy prices, US activity).
Their currencies, as a group, were the best performing last year, well above the ten or even five-year historical performance figures (e.g. average annual depreciation at group level is -3% over last ten years). This outcome against global headwinds (strong dollar, high US yields, oil price surges) supports the idea of an increasing institutional maturity and resilience.
Mexico’s  peso and Brazil’s  real are particular standouts. Mexico is benefitting from supply chain repositioning with the US policy resulting in growing exports. The Mexican peso is also clearly supported by prudent monetary policy (high real rates) and low public debt-to-GDP.  Brazil survived political transition unscathed and worst fears around fiscal policy have been averted. Similarly to Mexico, real GDP growth has surprised to the upside, with real rates still around 5-7% in both countries, policy setting could ease further without excessive currency risk.
Under the slow global growth circumstance outliers such as India stand out. Private and public sector balance sheets are healthy. Private sector credit is growing steadily and there is sufficient budgetary headroom for a genuine capital investment cycle to emerge. These positive dynamics have fed into rupee’s performance in recent times (roughly flat last year and one of the lowest currency volatility in 2023 across our 27 economies studied).
South Korea is the fourth largest economy in Asia with considerable financial depth and resilience. A trade-exposed economy means the won has struggled under the weight of weak demand from China and Europe. A pickup in electronics exports would help, tentative signs of which have been seen in recent months’ data (a rebound in South Korean exports). However, for as long as Japan allows depreciation against the RMB so South Korea is highly likely to follow suit – both are vulnerable to RMB depreciation versus the dollar.

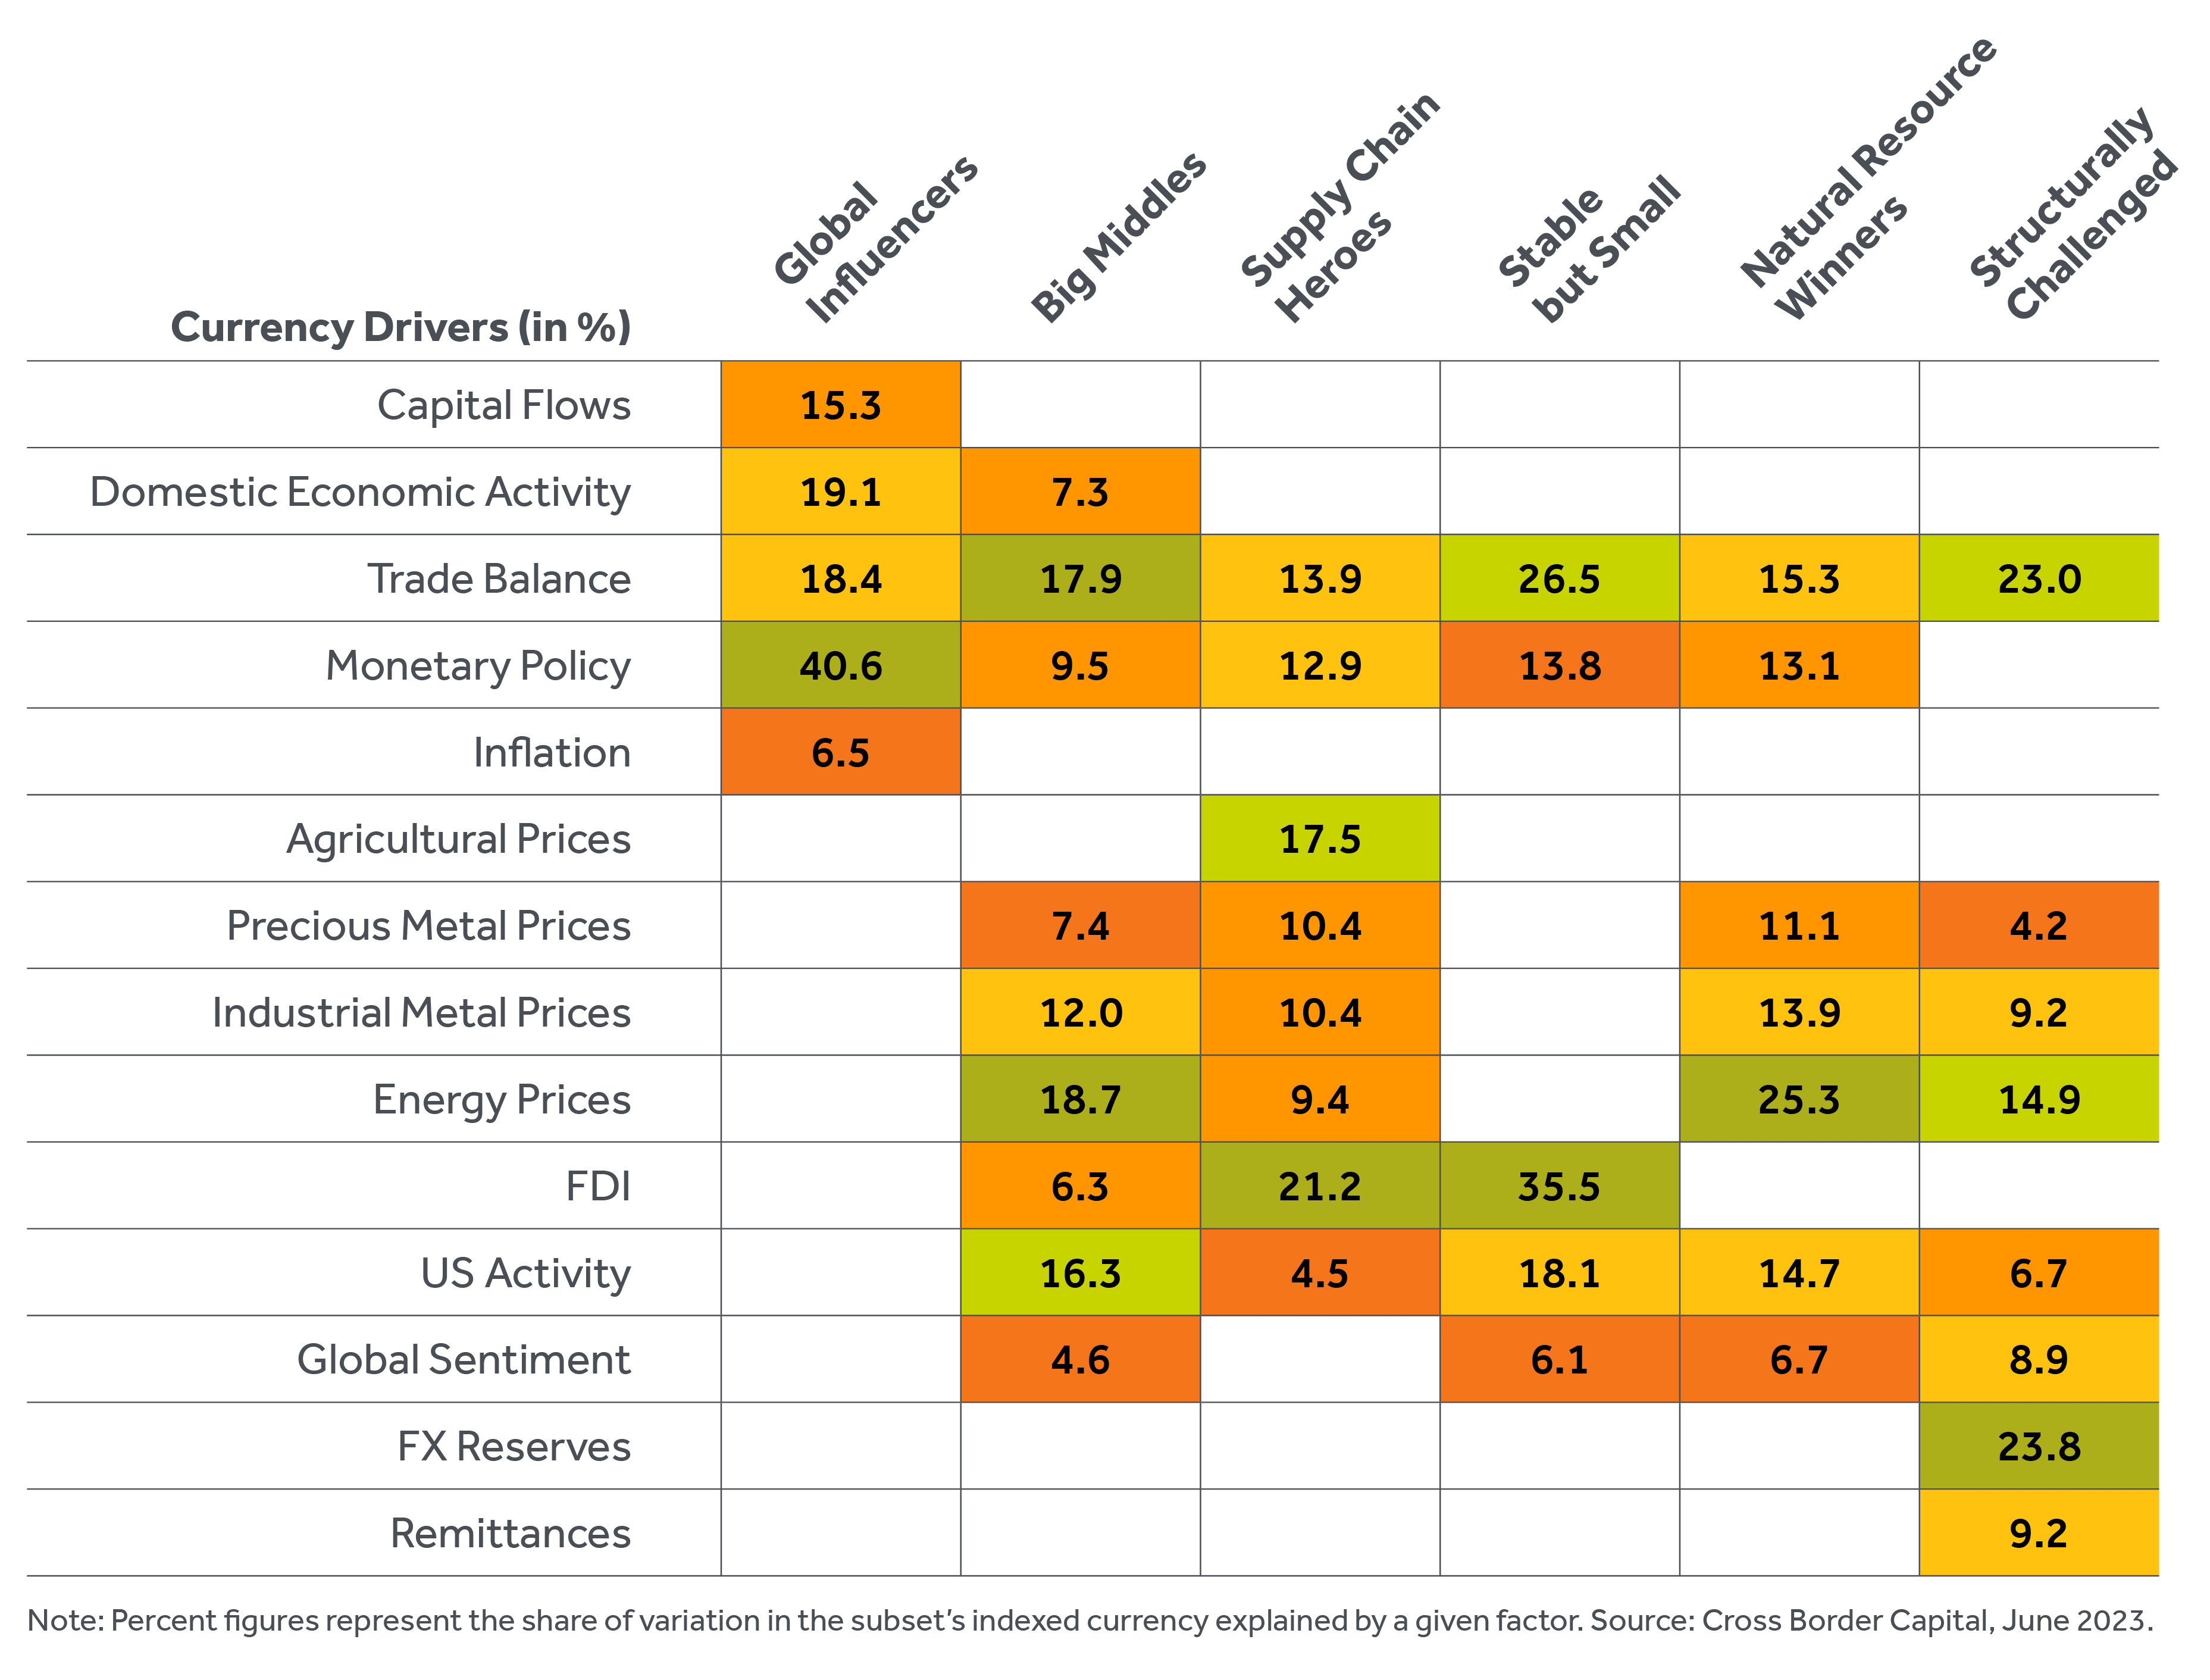
Supply Chain Heroes are materially exposed to non-resources targeted FDI, so-called China Plus One, and generally operate orthodox policies. These countries vary in attractiveness with their ability to absorb capital and the global economic cycle. However, for those who succeed, investment opportunities can be multiyear. Their currencies are primarily driven by FDI flows and trade balances, with the importance of these factors increasing in recent years.

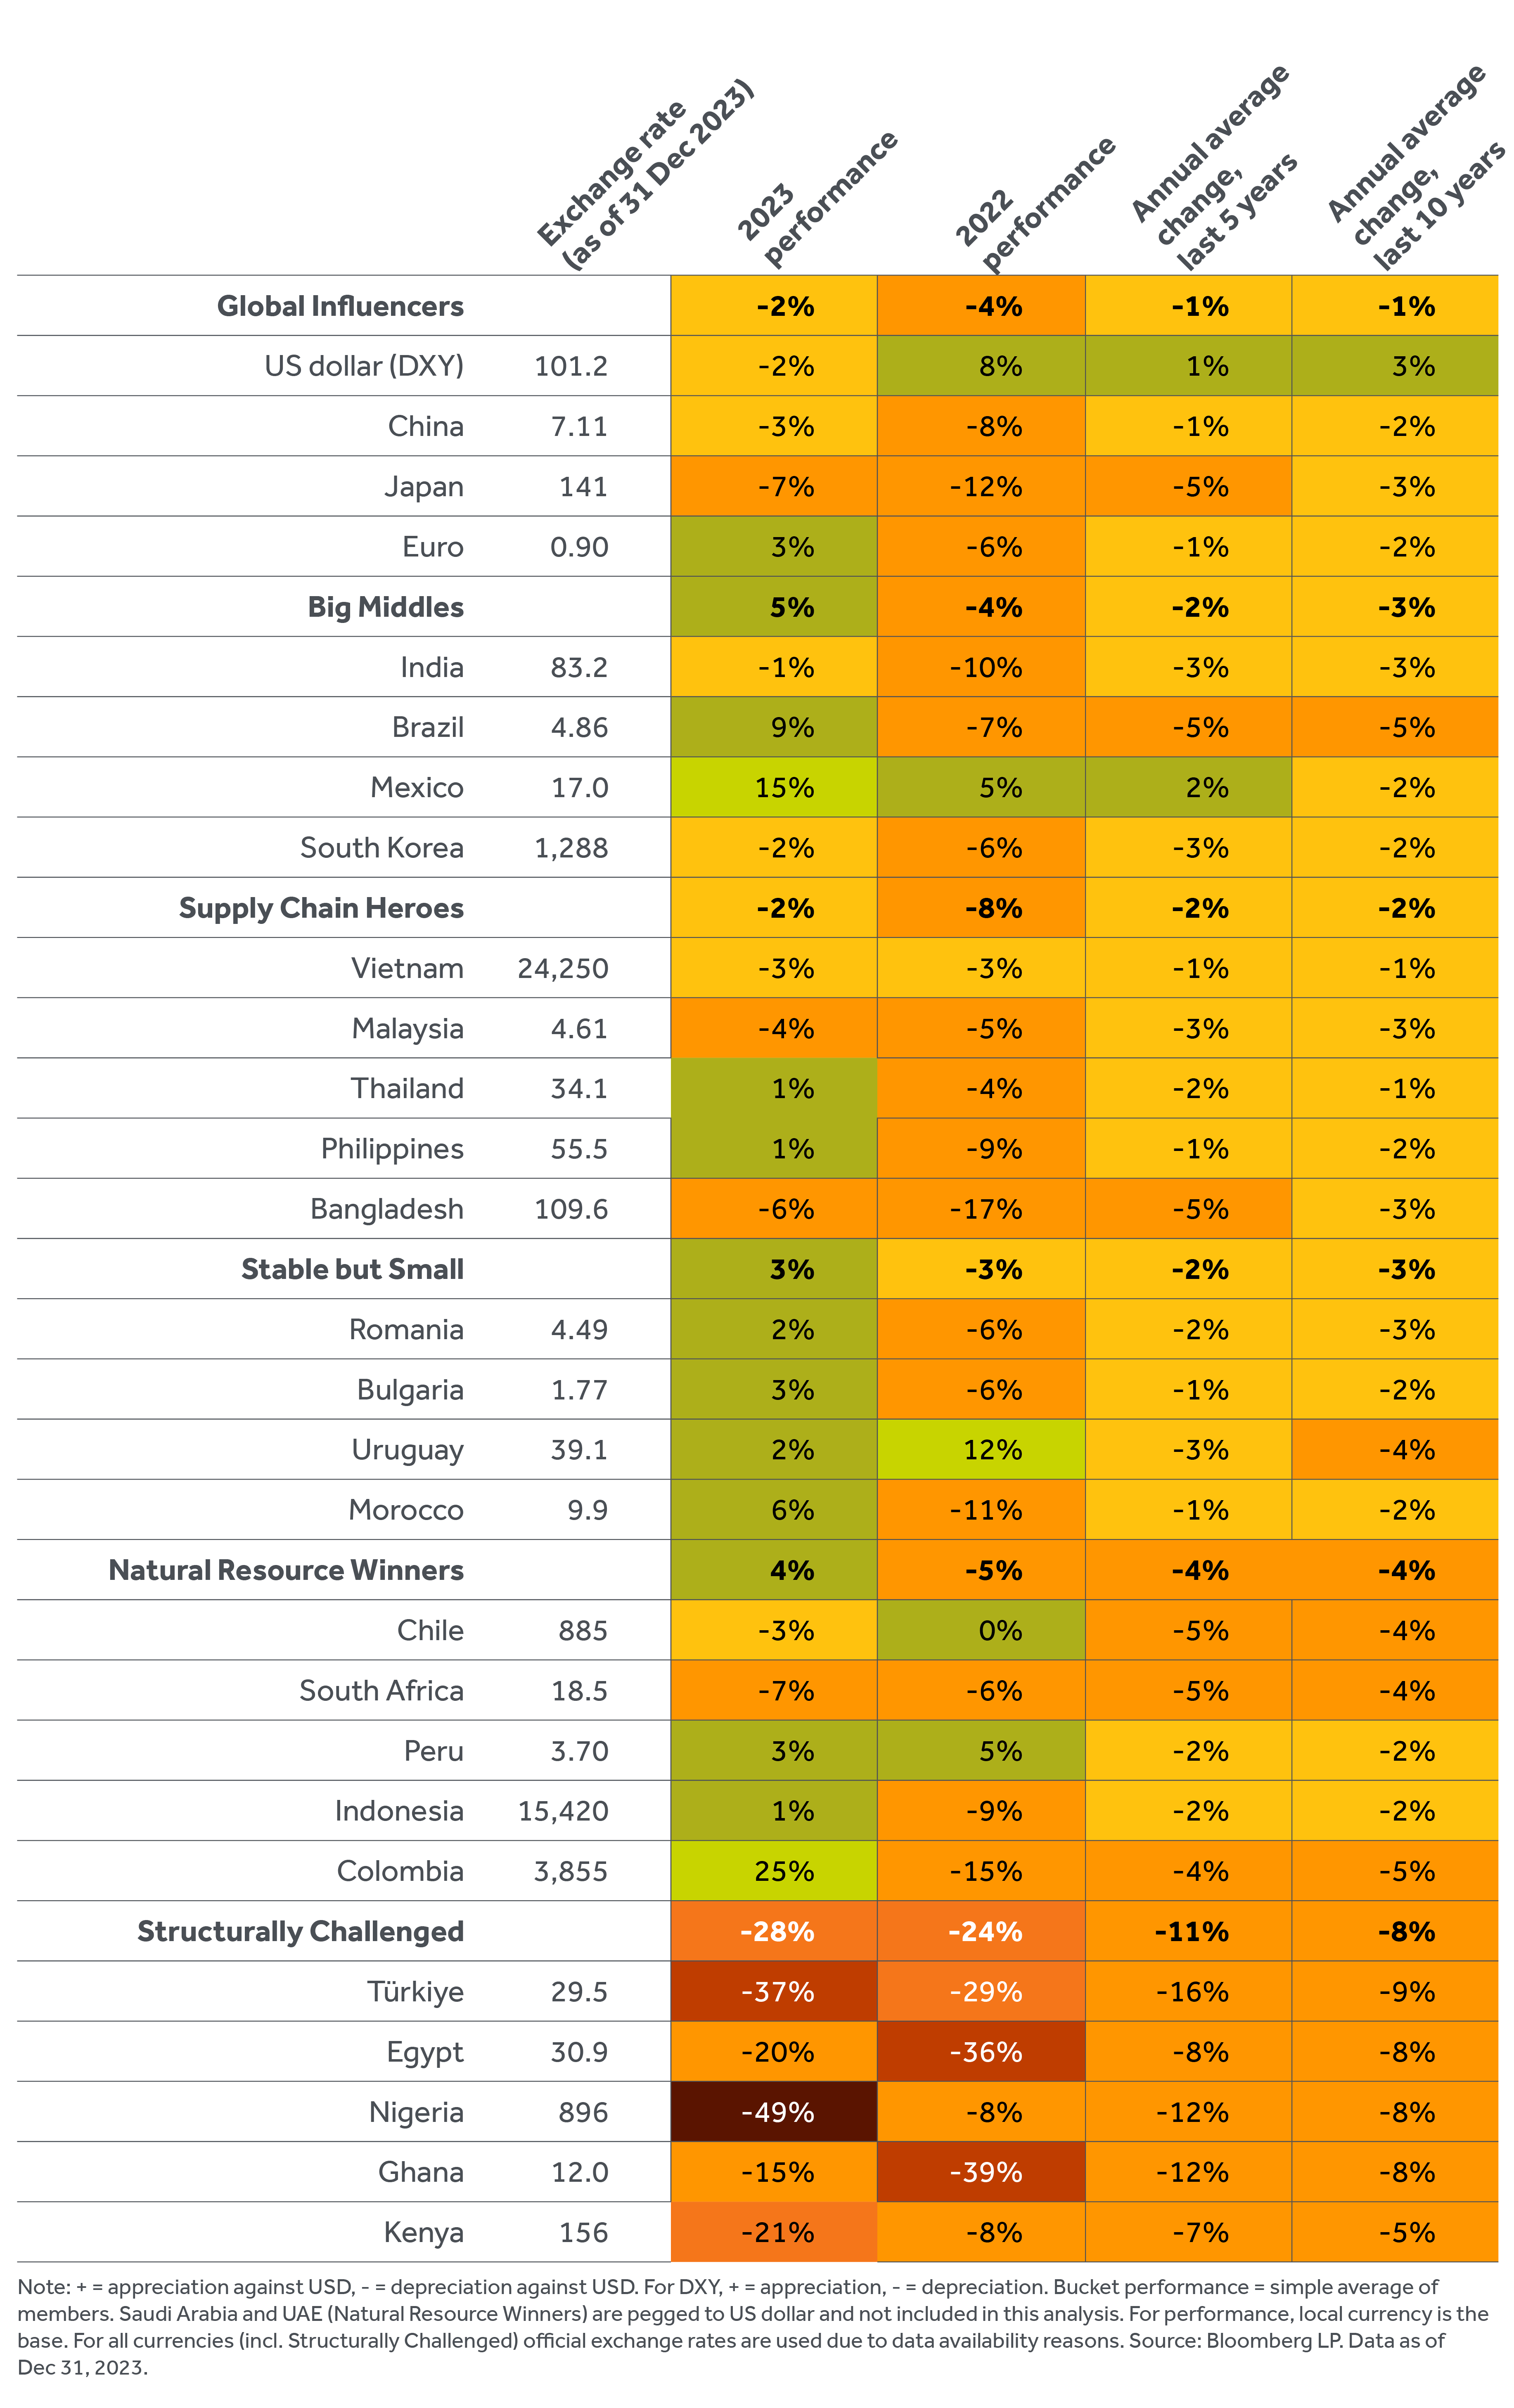
Trade sensitive economies struggled last year, as reflected in the weakening trend of Supply Chain Heroes’ currencies in 2023. These are cyclical pressures and global trade would respond positively to any successful stimulus from China and/or turnaround in the electronics cycle – which has yet to properly materialise.

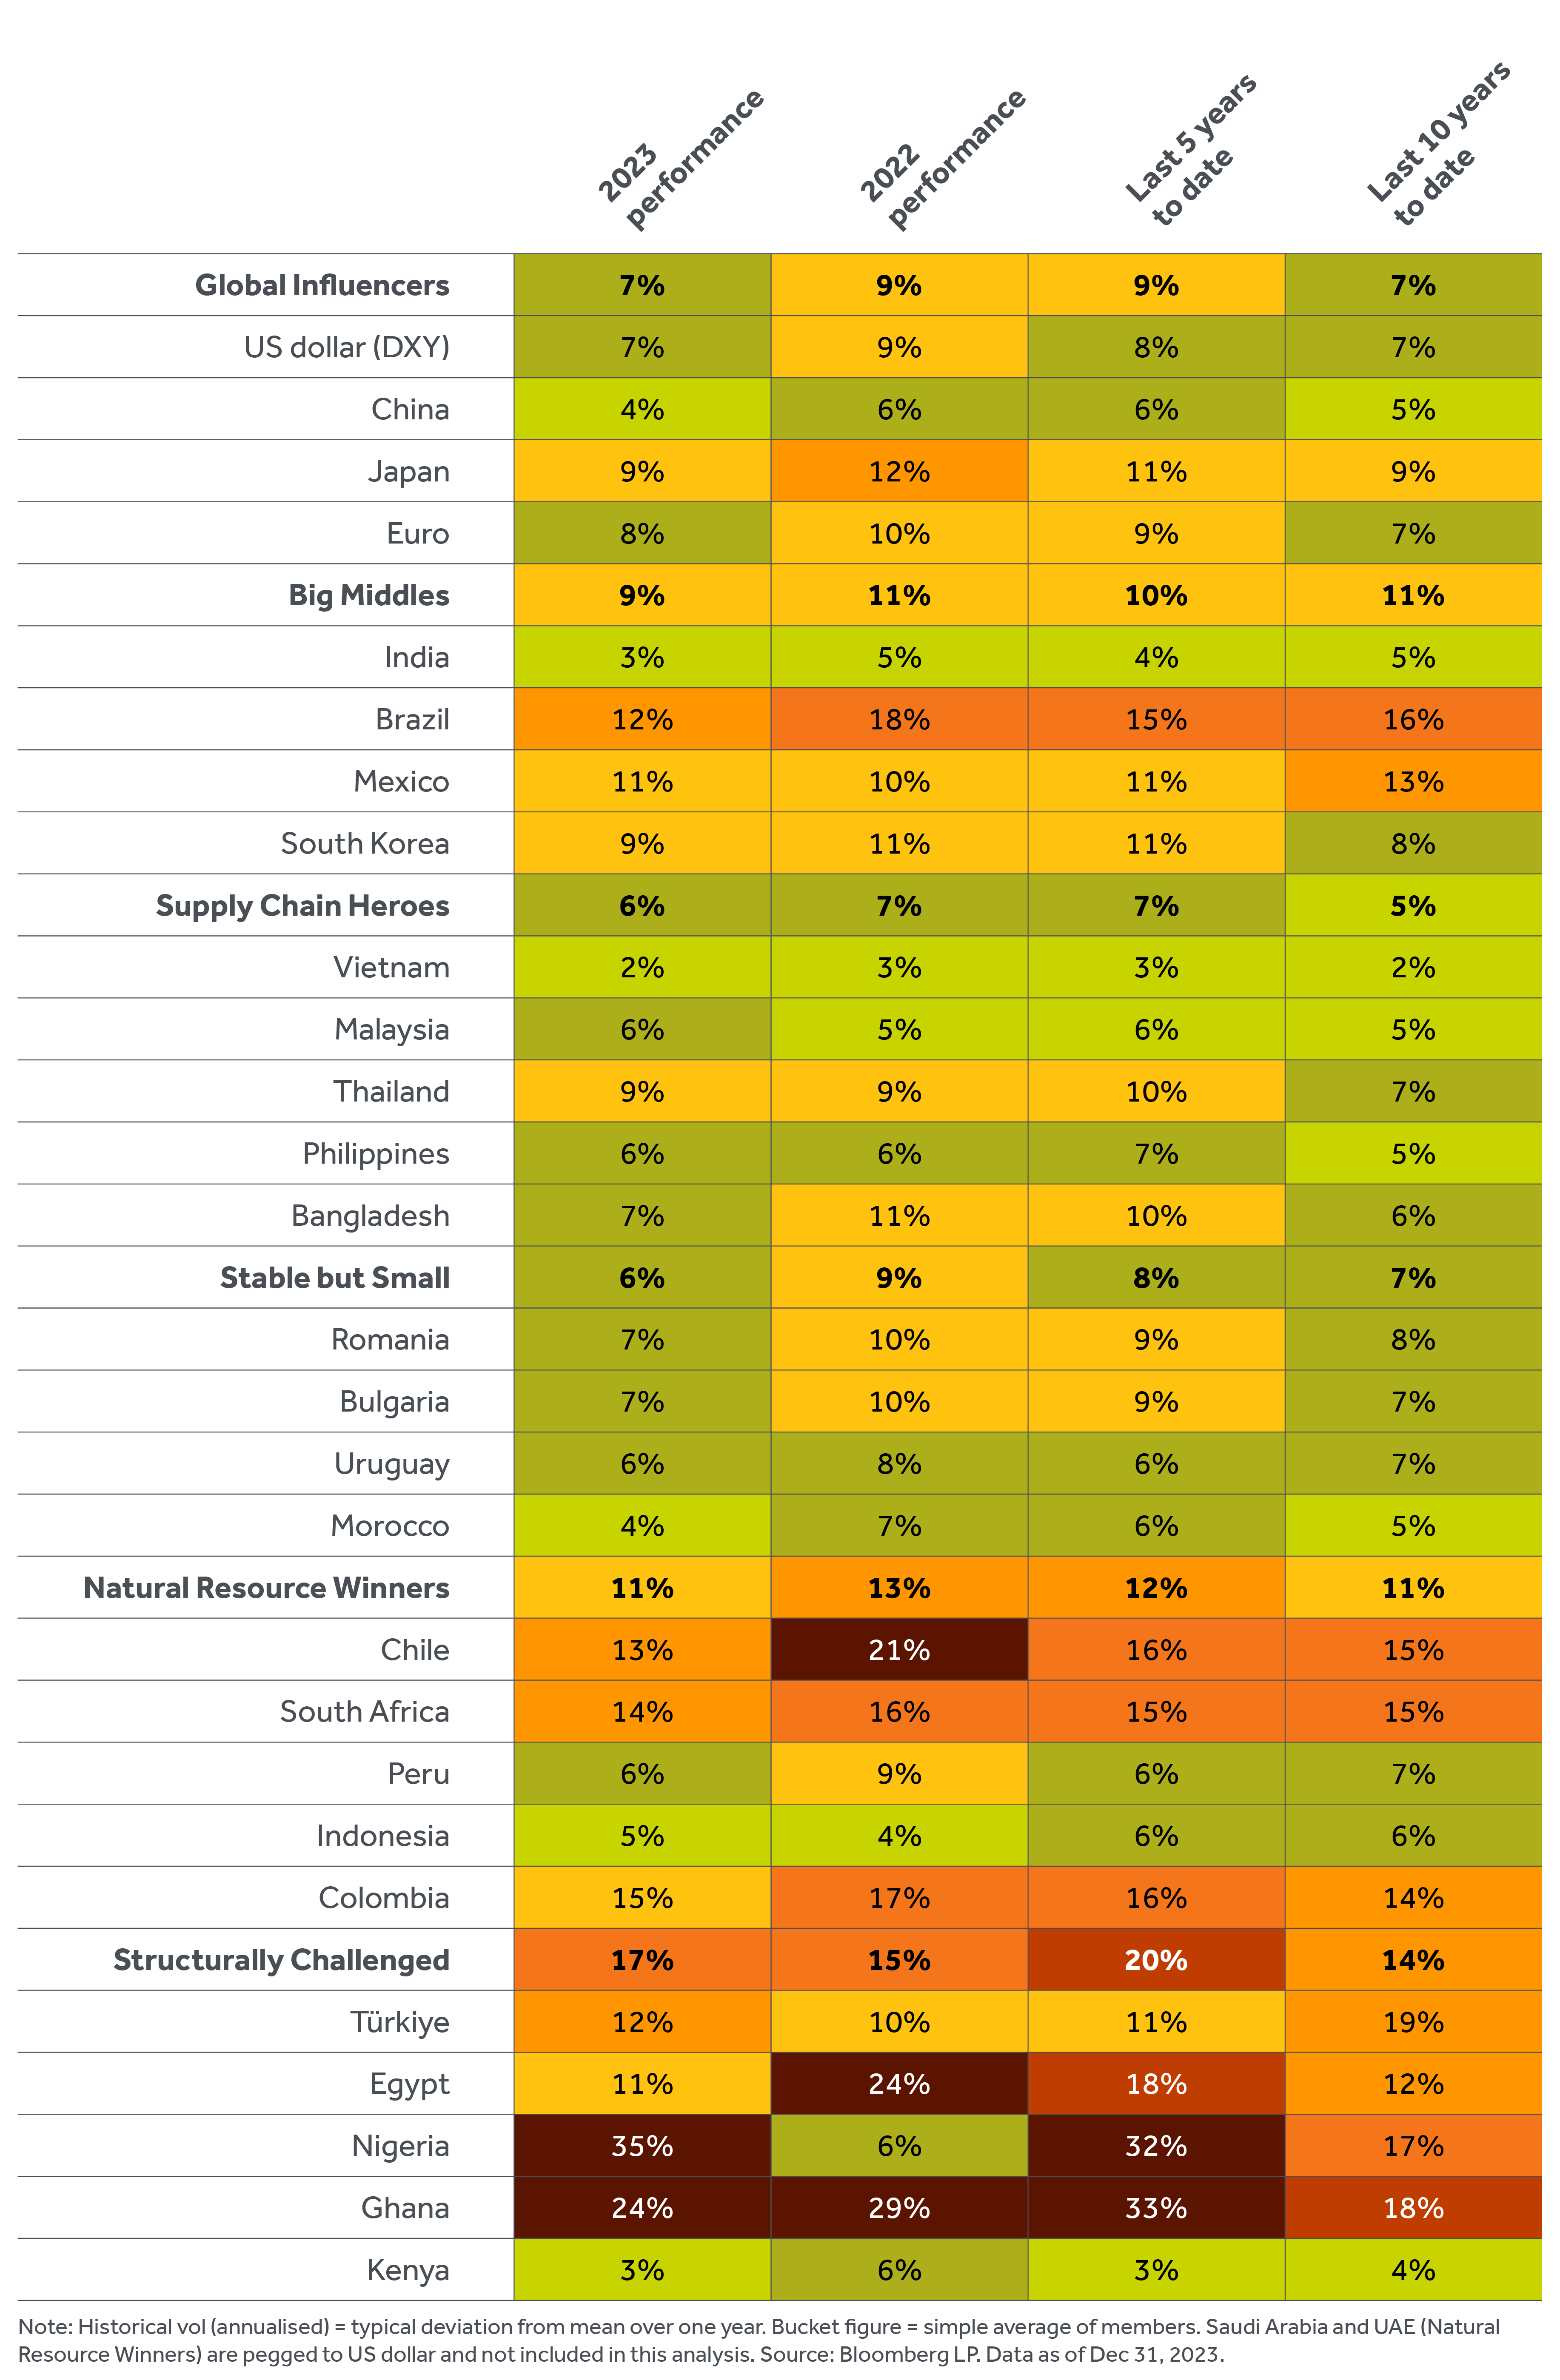
Underlying fiscal and monetary policies supported low currency volatility even last year (despite depreciation pressures) and continue the trends of the last 5 and 10-years. One question mark though, is whether already cheap currencies could cheapen further if the RMB continues to depreciate. We cannot rule out this possibility.

For Stable but Small economies size means these countries, despite having sensible policy mixes import risk from larger economies in particular larger neighbours. The currencies in this bucket are primarily sensitive to the economic activity, monetary policy and flows of Global Influencers.

Central and Eastern Europe tracks mainstream Europe and the euro. As a group, their currencies were slightly up last year, reflective of similar performance for the euro (against which BGN is pegged, MAD semi-pegged and RON bound-managed). The region has also benefitted from EU’s bolstered structural investment fund flows and commitments on the back of the Ukraine crisis.

Declining inflation has allowed some headroom to cut interest rates although the example of Poland, where recent cuts led to a material currency sell-off, is discouraging. Political risks though are rising as proxied by the recent election of a pro-Russia leaning government in Slovakia and the impossible to predict but draining effects of the Ukraine war.

Natural Resource Winners are materially net exporters of one or more commodities. These economies vary enormously, not least in the cycles for their product. Energy transition has the potential to alter the landscape in this bucket as demand for associated materials soars relative to fossil fuels. This group is highly sensitive to commodity prices, with energy and metals prices driving more than half of their currency movements.

Natural Resource Winners’ currencies excluding USD pegged (i.e. the Gulf region) remain characterised by highly volatile outcomes, with divergences in commodity prices last year playing an important role. Agricultural prices have fallen as the worst supply side disruptions from the Ukraine war dissipated. The copper price has declined by nearly 15% as China cools and zinc too was weak until recently. The standout is oil where production cuts, more robust than expected demand and geopolitics have supported prices until recently. Worth noting here that after an initial spike in the wake of the October 7th 2023 Hamas attacks that the oil price failed to hold on to immediate gains suggesting demand side dynamics are paramount.

As a group, performance was roughly flat last year. Whilst Natural Resource Winners are arguably generally in a good shape, close up there is a more varied picture. Domestic factors such as rate cutting played a role last year (see CLP vs PEN divergence), or leftist labour reform rejection in Colombia (partially behind COP’s strong run). Characteristically, and aligned with the last 5 and 10-year trends, their currencies were the most volatile in 2023 across our Actis Atlas buckets excluding Structurally Challenged.

That said we distinguish between commodities closely linked to Chinese capital investment and those more exposed to energy transition needs. In general, this should help Andean countries. Economic slowdown will most probably block material upside in the oil price from the mid $80’s (bar a major regional war in the Middle East). This hardly dents budget surpluses in Saudi Arabia and the adjoining GCC countries. It is hardly a surprise that these countries increasingly are exercising influence abroad through supporting struggling neighbours and are also the main global source of new investment funds.

Structurally Challenged are countries where past policy decisions and low income and fiscal revenue levels have created material macroeconomic and currency volatility. Investment is best concentrated in sectors with strong risk protection including credit enhancement, political risk insurance and FX/inflation indexation. This bucket’s currencies are particularly sensitive to FX reserve levels and remittance flows.

As a group, Structurally Challenged currencies performed the worst last year (down -28% using official exchange rates). Tighter global financial conditions hardly help countries with financing issues. It is not a coincidence that severe dollar shortages currently characterize most of the countries in this bucket (as seen in the increasing recent divergence between parallel and official exchange rates in Nigeria and Egypt). The immutable Law named after 16th century policymaker Thomas Gresham has played out again. Given the choice between a constantly declining currency and a store of value people hoard the latter. Parallel rates 30-50% different from official rates usually end in the official rate losing out, domestic recessions and wholesale import substitution.

As examples Kenya abandoned efforts to refinance maturing Eurobonds and availability of dollars in Nigeria remains problematic. Egypt can rely on GCC and IMF financial support, but an unofficial rate of 55 plus and an official level around 31/$ takes a lot of bridging. Rates in Türkiye may have plateaued at 45% but are still 20% negative once adjusted for inflation. The new economic team is talking a good game but has some way to go before any real stability can be predicted. FDI though has picked up and a seasonal boost to the current account surplus helps. But after falling more than 90% versus the dollar over the last decade a lot of work still needs to be done to restore its credibility as a source of value. Türkiye though is a significant manufacturing economy on the edge of a major economic bloc. A replay of Mexican and ASEAN recovery after their respective 1995 and 1998 crises remains possible (in both cases a pick-up in FDI as Türkiye is seeing now was an early sign of recovery).

Looking ahead, currencies, rates and economic resilience will largely depend on whether a global recession will materialise. Forecasts suggest more mixed fortunes on a 12–24-month basis but still favour Big Middles, Supply Chain Heroes and Stable but Small as a whole. US activity remains a key factor looking forward.

Exhibit Links

Click to open full screen exhibit

Exhibit 4

What drives currencies?

Our view is that there will not be a major global recession in the next 6-12 months absent a material increase in geopolitical risk although some regions and countries will struggle to grow. We base this view on the combined effects of the prevalence of fixed-rate mortgages in the US (shielding the vast majority of their homeowners) and policy action in China. Albeit having declined to pre-pandemic averages, there is still enough fuel in the tank of US household savings and full employment to offset the impact of rate rises. 

We also believe China pessimism has become excessive at this point. The risks to our view are that we underestimate the degree of monetary tightening and/or that severe asset quality risks arise in the US commercial real estate market. A further risk would be an accentuation of global political risk with a near term focus on the Israel-Gaza war escalation and the Russia/Ukraine conflict.

MORE FROM THIS EDITION

Exchange rate performance, 2023 and historical.

Exhibit2-Jan24

Source: Bloomberg LP. Data as of Nov 14, 2023

Exchange rate volatility (annualised), year-to-date and historical.

Exhibit3-Jan24

What drives currencies?